
Highlights
Ultrahigh resolution mass spectrometry was used to identify novel brominated disinfection byproducts in a Canadian water treatment facility.
Several hundred novel brominated compounds were identified of which 54 were assigned chemical structures.
Seasonal variation in the generated DBPs were assessed over 11 months of sampling.
Increases in total bromine in drinking water was noted with progress thru the treatment process.
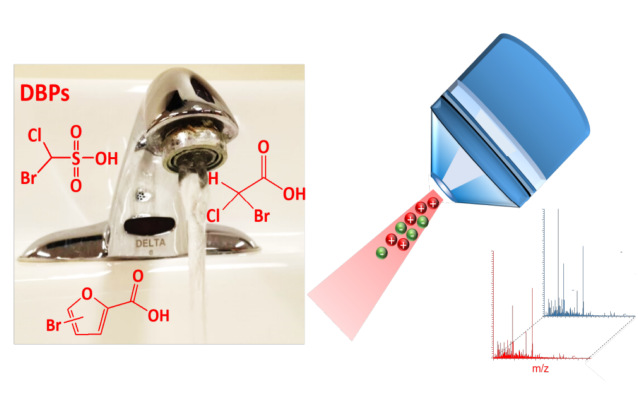
Abstract: Brominated disinfection by-products (Br-DBPs) can form during chlorination of drinking water in treatment plants (DWTP). Regulations exist for a small subset of Br-DBPs; However, hundreds of unregulated Br-DBPs have been detected and limited information exists on their occurrence, concentrations, and seasonal trends. Here, a data-independent precursor isolation and characteristic fragment (DIPIC-Frag) method was optimized to screen chlorinated waters for Br-DBPs. There were 553 Br-DBPs detected with m/z values ranging from 170.884 to 497.0278 and chromatographic retention times from 2.4 to 26.2 min. With MS2 information, structures for 40 of the 54 most abundant Br-DBPs were predicted. The method was then applied to a year-long study in which raw, clear well, and finished water were analyzed monthly. The 54 most abundant unregulated Br-DBPs were subjected to trend analysis. Br-DBPs with higher oxygen-to-carbon (O/C) and bromine-to-carbon (Br/C) ratios increased as water moved from the clear well to the finished stage, which indicated the dynamic formation of Br-DBPs. Monthly trends of unregulated Br-DBPs were compared to raw water parameters such as natural organic matter, temperature, and total bromine, but no correlations were observed. It was found that total concentrations of bromine (TBr) in finished water (0.04–0.12 mg/L) were consistently and significantly greater than in raw water (0.013–0.038 mg/L, P < 0.001), suggesting the introduction of bromine during the disinfection process. Concentrations of TBr in treatment units, rather than raw water, were significantly correlated to 34 of the Br-DBPs at α = 0.05. This study provides the first evidence that monthly trends of unregulated Br-DBPs can be associated with the concentration of TBr in treated waters.
Keywords: Natural organic matter; Bromine; Chlorination; Drinking water treatment; High-resolution mass spectrometry
DOI: 10.1016/j.eehl.2022.06.002